
You may have installed Google Analytics on your website or blog years ago, but you have not given it too much thought since. But you’ve heard that you need to update Google Analytics. It’s changing from Universal Analytics to Google Analytics 4 (GA4).
What does that mean, what’s changed, and how do you get GA4 set up correctly so that you don’t lose any vital tracking data?
Don’t worry if you’re worried about delving into anything techy. We’ll take it all step by step, so whether you’re upgrading from Universal Analytics to Google Analytics 4 or you’re getting set up with Google Analytics for the very first time, I’ll walk you through the whole process.
GA4 for Bloggers: How to Get Started (and Set up) with Google Analytics 4
- What is Google Analytics?
- Google Analytics 4 vs Universal Analytics?
- How to Upgrade to Google Analytics 4 (Step-by-Step Instructions)
- How to Create a Google Analytics Account for the First Time
- Adding the Google Analytics Tracking Code to Your Website
- Understanding Metrics from Google Analytics 4 (to Help Grow Your Traffic)
Disclosure: Please note that some of the links below are affiliate links and at no additional cost to you, I’ll earn a commission. Know that I only recommend products and services I’ve personally used and stand behind. When you use one of my affiliate links, the company compensates me, which helps me run this blog and keep my in-depth content free of charge for readers (like you).
Create Automated SEO Blog Posts in Minutes with RightBlogger

Join 45,417+ bloggers, marketers, writers & business owners in using RightBlogger, my very own Autoblogging solution with a built-in automated Content Schedule, and a kit of 80+ powerful tools for blogging, SEO, and marketing. You’ll create AI SEO-optimized content faster & get more traffic from Google and ChatGPT today. Plus, you’ll access online courses, a community, and more.
What is Google Analytics?
Google Analytics is a free online analytics tool from Google that collects data about your website traffic. Here’s a snapshot of my ryrob.com GA4 real-time overview report:
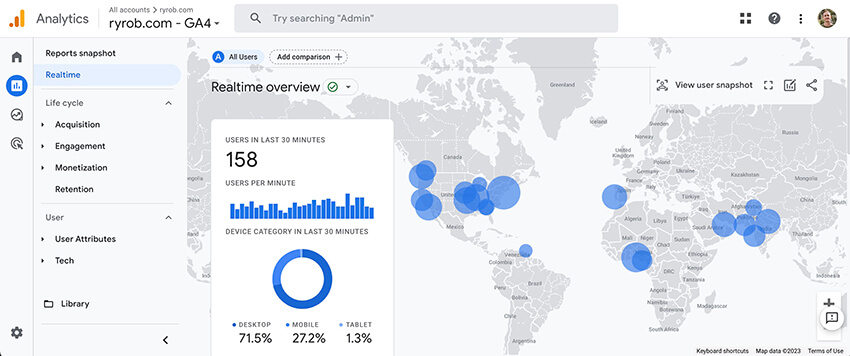
This detailed analytics data helps you determine which blog posts are most popular on your site, what content converts visitors into paying customers, how long people stay on your site, and more.
Why You Need Google Analytics for Your Website
Whether you’re just starting or have a huge website or blog, you need Google Analytics. There is no comparable tool for seeing how visitors use your website—plus, it’s free, so there’s no reason not to use it.
Google Analytics can show you all sorts of data about your website. At its most basic, you could use Google Analytics to see if your traffic is growing or diminishing, month by month.
You can track which pages are getting the most traffic, which helps you make decisions about, for instance, what ideas to write about in the future or what content you should update and optimize next to rank higher on Google. You can also see where your visitors are coming from (directly, from social media, from another website, or a search engine like Google).
It’s not hard to use Google Analytics. Setting it up on your website takes a few minutes, and then you can look at your data and run reports any time you want by signing into your Google Analytics account. WordPress plugins like MonsterInsights also bring Google Analytics data right into your WordPress dashboard.
Google Analytics 4 vs. Universal Analytics
Google Analytics 4 (GA4) is the latest version of Google Analytics, replacing Universal Analytics (UA).
It has new functionality, like giving you (and your website visitors) more precise control over the personal data that your site collects.
One big difference is that Google Analytics 4 measures user behavior through “events” (like clicking a button, loading a page, or purchasing). By contrast, Universal Analytics focused on “sessions” and “hits.”
Google Analytics 4 is designed to gather cross-platform insights (when users access your site from two or more devices, e.g., mobile and desktop) to give you a better understanding of the customer journey. It also has predictive features: for instance, it can, through machine learning, tell you how likely it is that a user will purchase in the next seven days.
When Should You Switch from Universal Analytics to Google Analytics 4?
Ideally, you want to switch from Universal Analytics to Google Analytics 4 as soon as possible.
Google will discontinue Universal Analytics on July 1, 2023. To ensure you don’t lose any historical data, you should have Google Analytics in place before that date.
Don’t worry—switching to Google Analytics 4 is quick and easy. I’ll walk you through the process step by step.
How to Upgrade to Google Analytics 4 (Step-by-Step Instructions)
If you already have a Google Analytics account, here’s how to upgrade it from Universal Analytics to Google Analytics 4.
Step 1. Check if You Need to Upgrade to Google Analytics 4
If you created your property (your website’s listing within your Google Analytics account) after October 14, 2020, you’re probably already fully set up with Google Analytics 4.
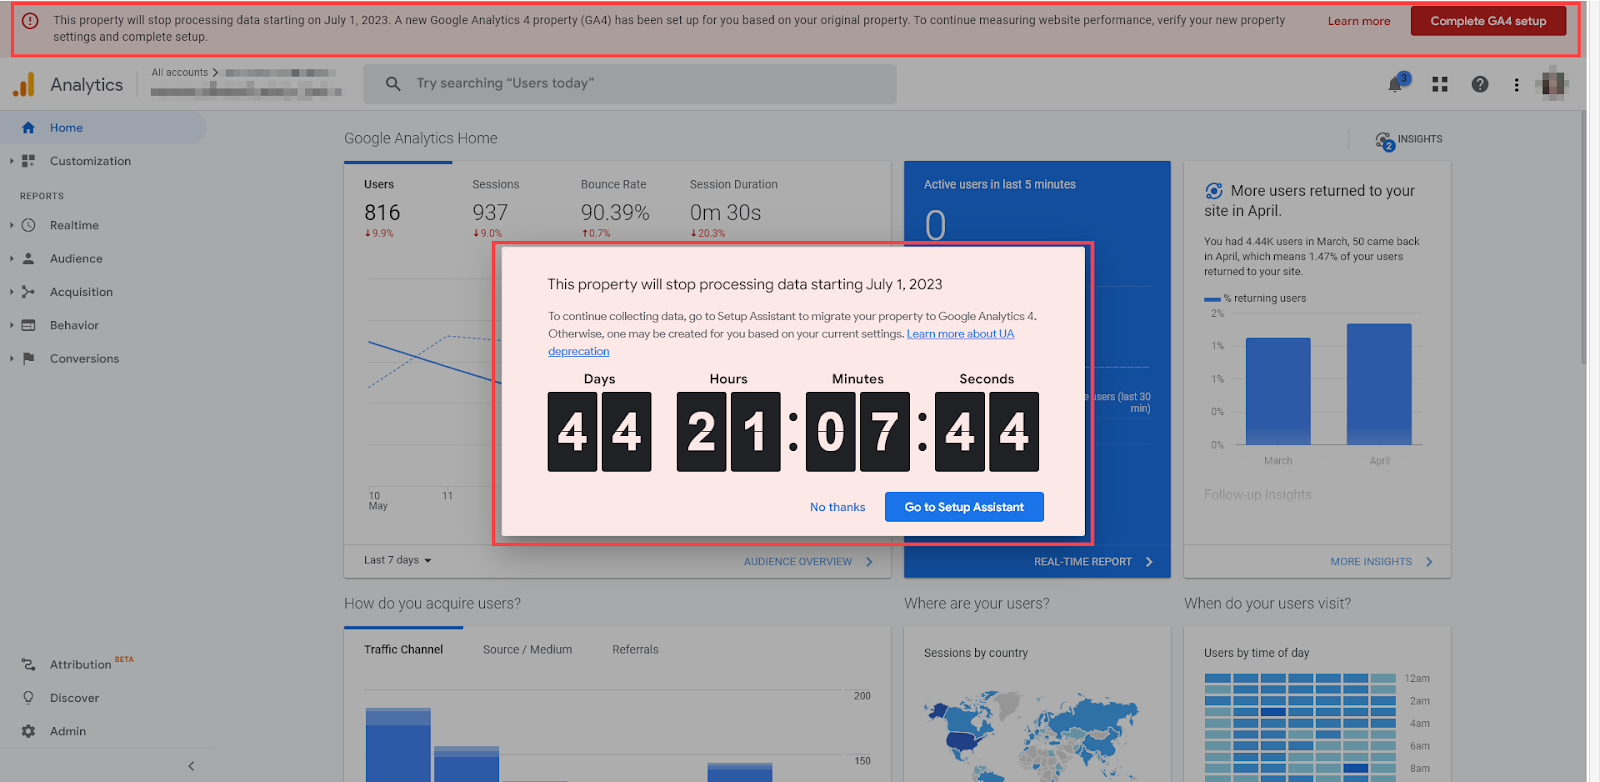
To check, log in to your Google Analytics account. If you haven’t set up Google Analytics 4, you should see a notification at the top of the screen, likely telling you that Google has created an essential GA4 property for you.
Plus, if you haven’t dismissed it previously, there’ll also be a popup in the center:
Another way to check whether you’re using UA vs GA4 is to find your property ID. Click the down arrow next to the name of your website (on the top left), and then look for a number that starts with “UA-”
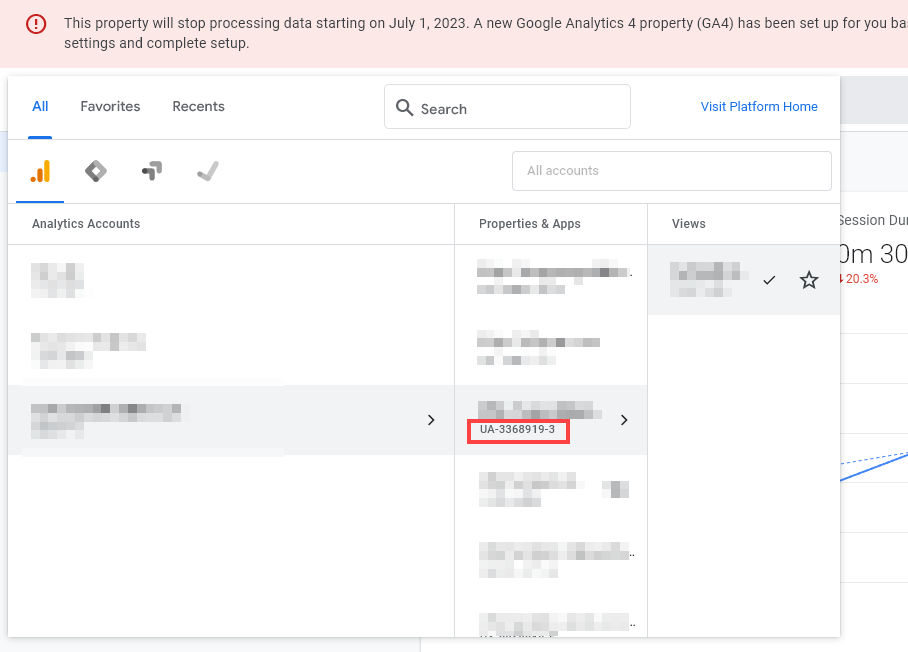
The “UA” stands for “Universal Analytics”. You need to finish setting up GA4.
Step 2. Create a GA4 Property to Work Alongside Your Existing UA Property
The next step is setting up the Google Analytics 4 Property that will collect data alongside your existing Universal Analytics property. (If Google Analytics hasn’t already automatically created one for you, you can set it up from scratch here.)
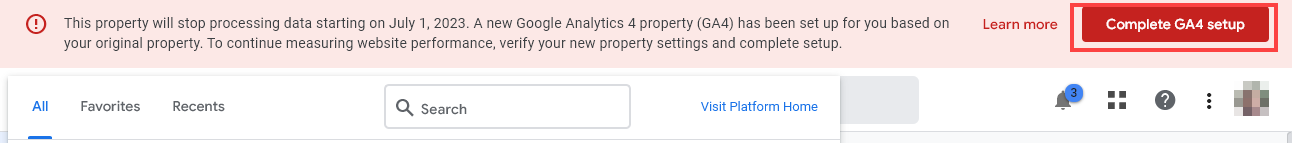
In your Google Analytics account, click on the Complete GA4 Setup button on the top right:
This will take you straight to the Setup Assistant, which you can also access by going to Admin→Setup Assistant. (The Admin button is the cog on the bottom left.)
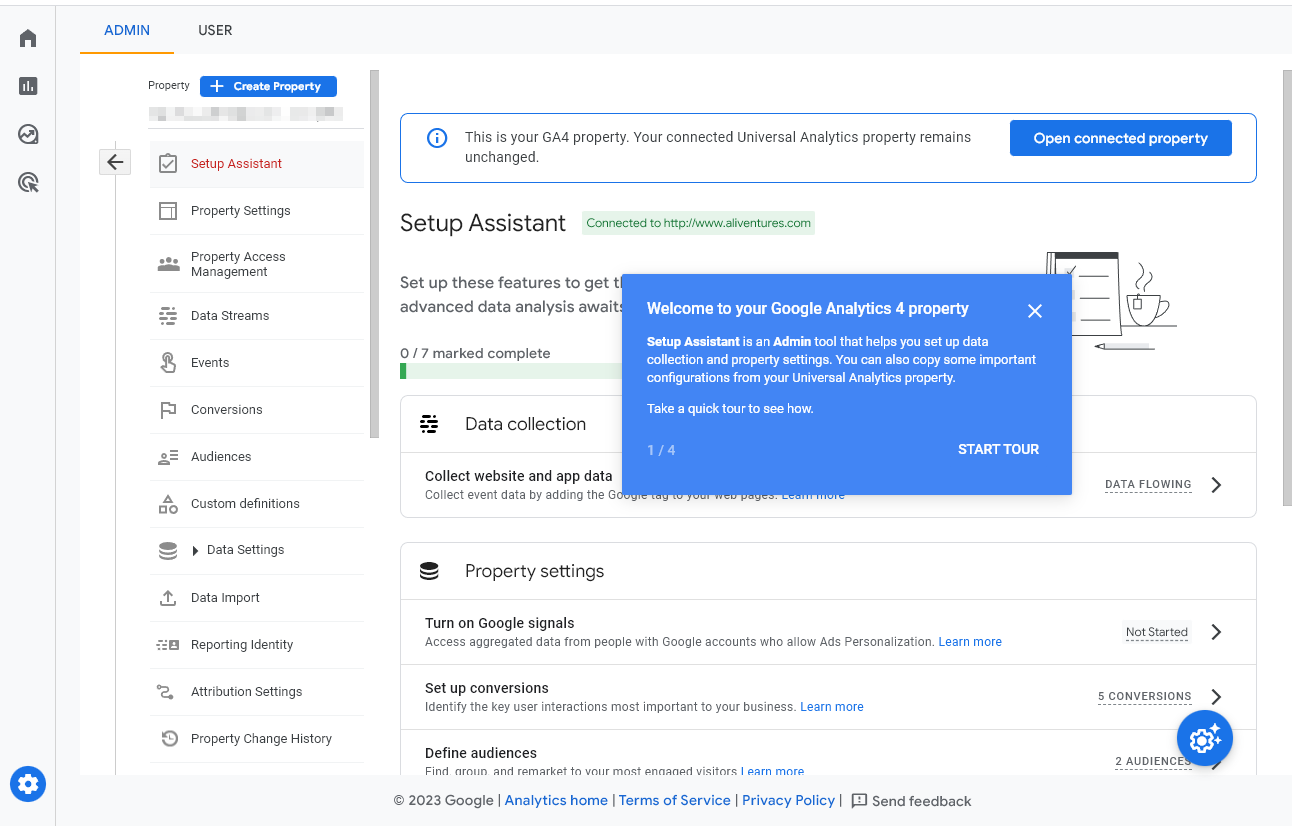
Once you’re on the Setup Assistant page, you can click “Start Tour” to explore some key features.
Then, simply follow the different tasks on this page in order. We’ll work through them one by one.
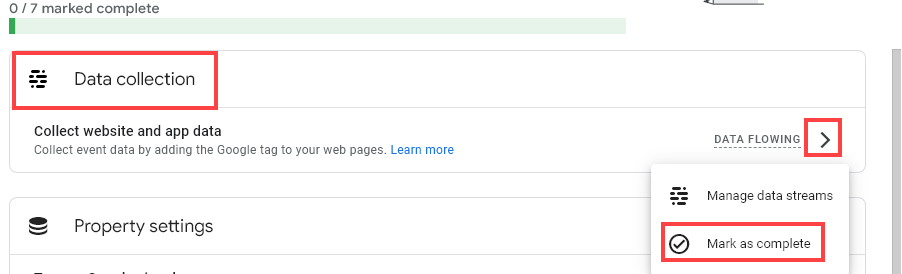
Data collection: Google Analytics will show “Data Flowing” here if it’s set up a GA4 property for you and it’s already receiving data from your site. You can click the > arrow to “Manage data streams” and check that your site is listed correctly. Once you’re ready, click “Mark as complete.”
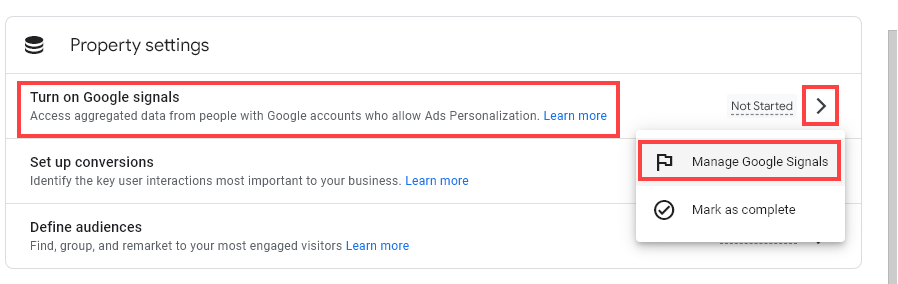
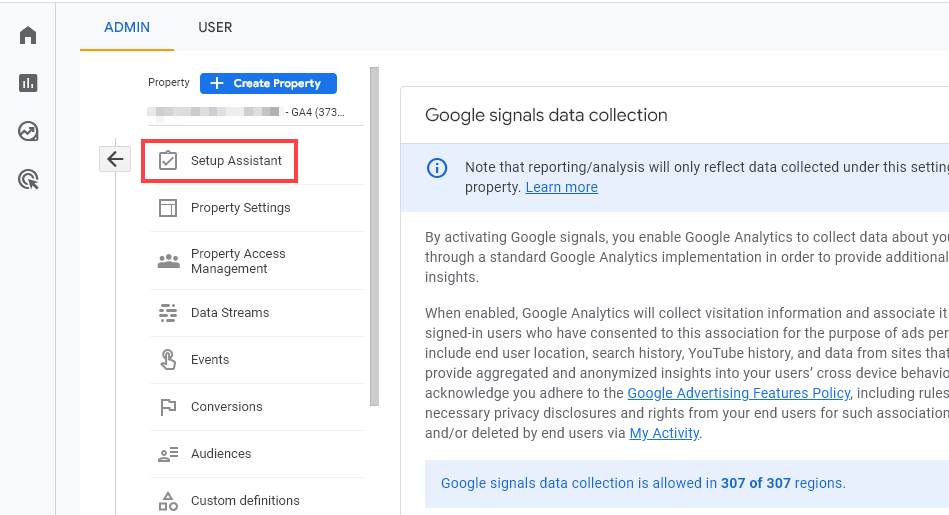
Property settings: You can fine-tune several settings for your website here. I recommend that you turn on Google Signals. Click the > arrow then “Manage Google Signals:”
You’ll be taken to the Google Signals data collection page. Click the “Get started” button.
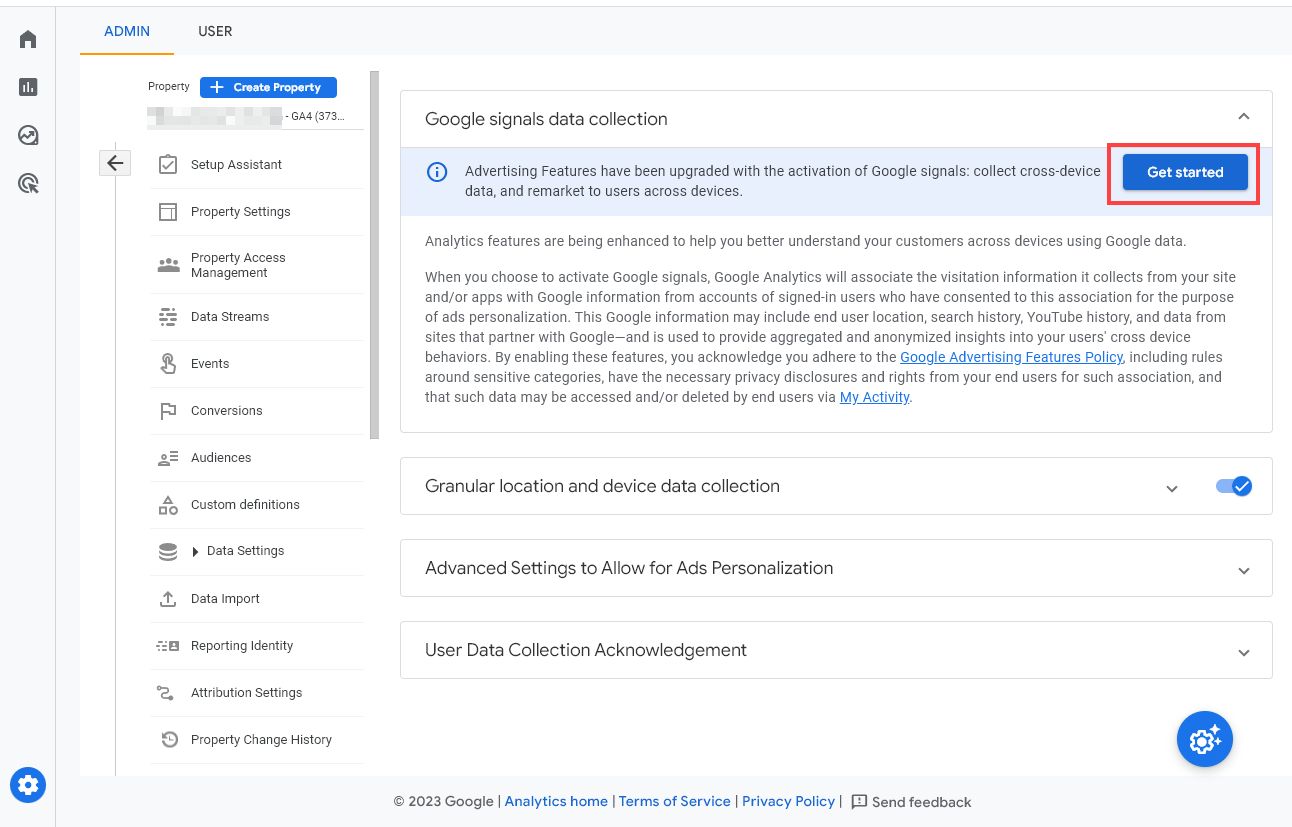
On the next pages, you just need to click “Continue” and “Activate.” Once you’ve done this, you’ll be returned to the Google Signals data collection page. You can return to the Setup Assistant using the link in the left-hand column.
Tip: You can also set up conversions and define audiences in Property settings (any you set up and defined previously in Google Analytics are preserved here – “segments” have become “audiences”). You may want to leave this for later.
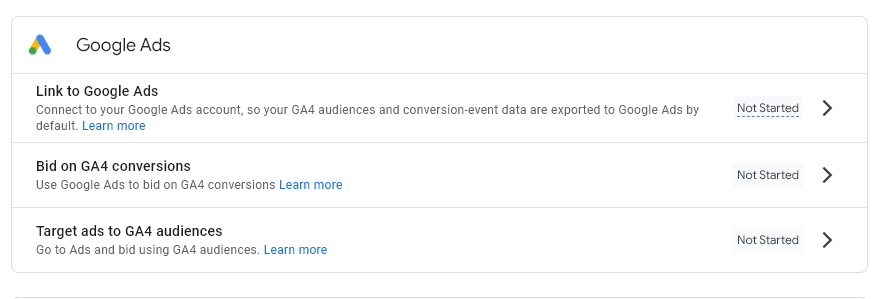
The final part of the setup assistant lets you link your Google Analytics account to your Google Ads account. If you’re using Google Ads, you can work through the tasks here.
Step 3. Make Sure Your GA4 Property is Collecting Data
Once you’ve finished working through the tasks, you can check out your GA4 property by scrolling up to the top of the page and clicking the “Open connected property” button:
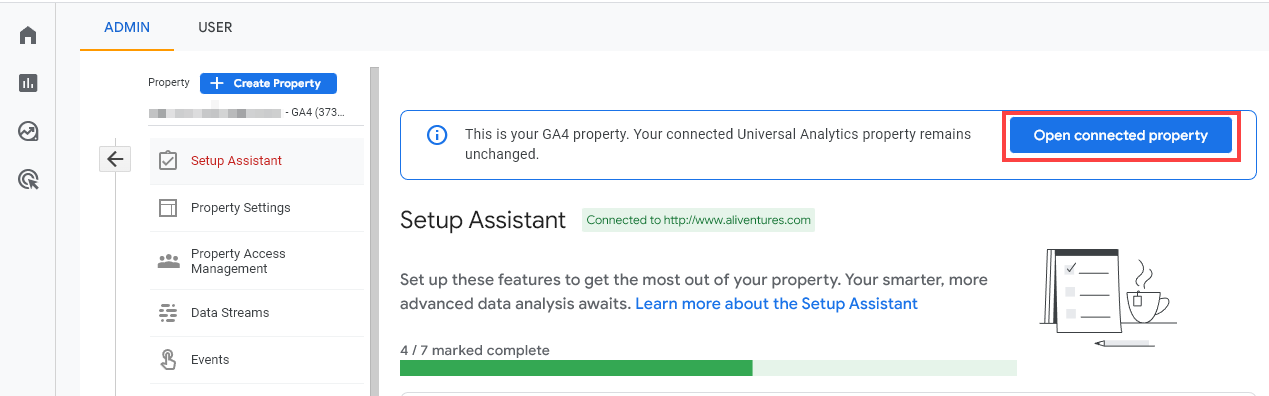
This will open up your connected GA4 property. You should see a message saying, “You have successfully connected your properties.”
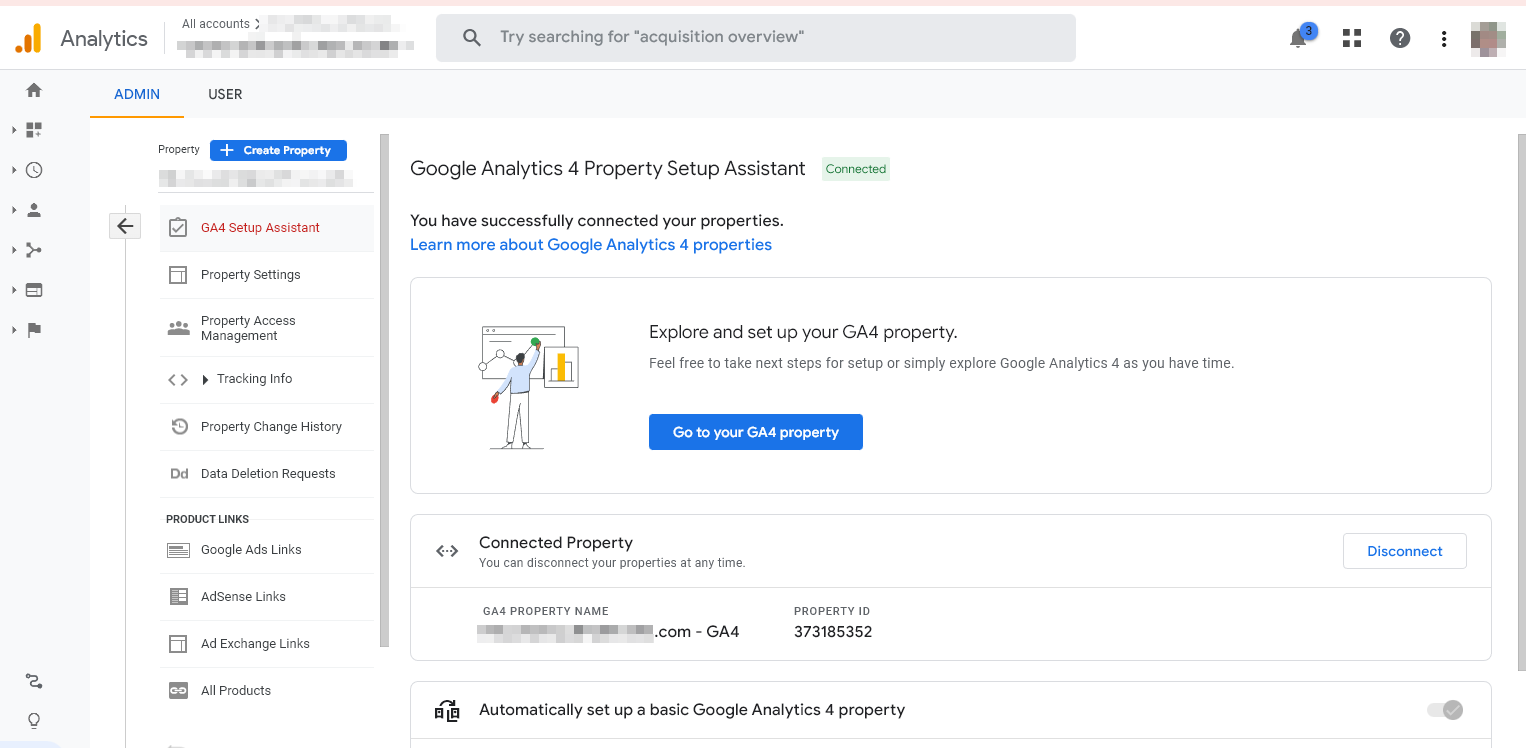
You can find out more about using the GA4 Setup Assistant here.
Now, return to the homepage of your Google Analytics account. You should see a popup welcome message introducing you to GA4:
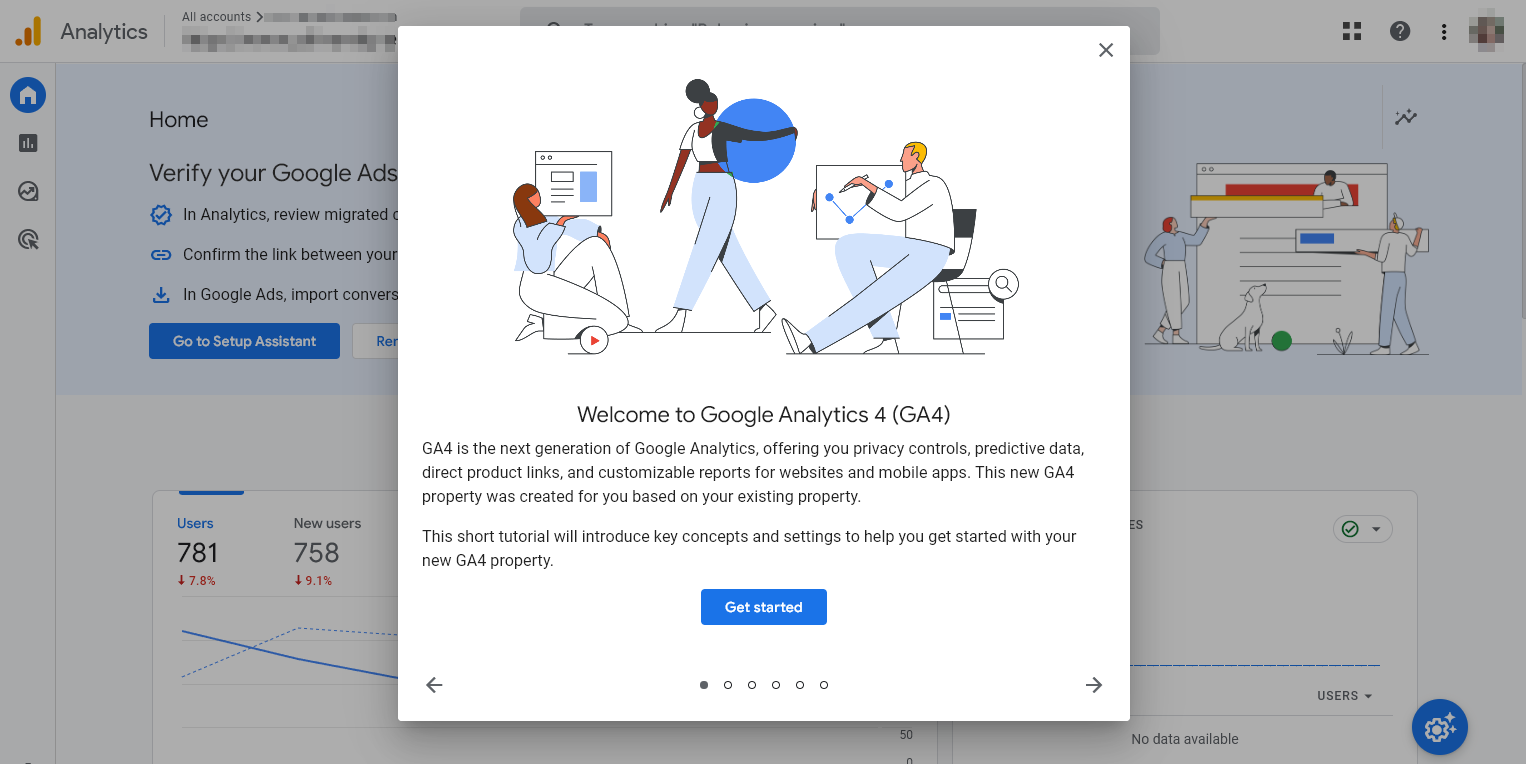
I recommend working through the short tutorial in this popup. It explains how to find your older data, manage reports, measure user behavior with GA4, build audiences, and more.
Once you close the popup, you can check out all your user data in GA4:
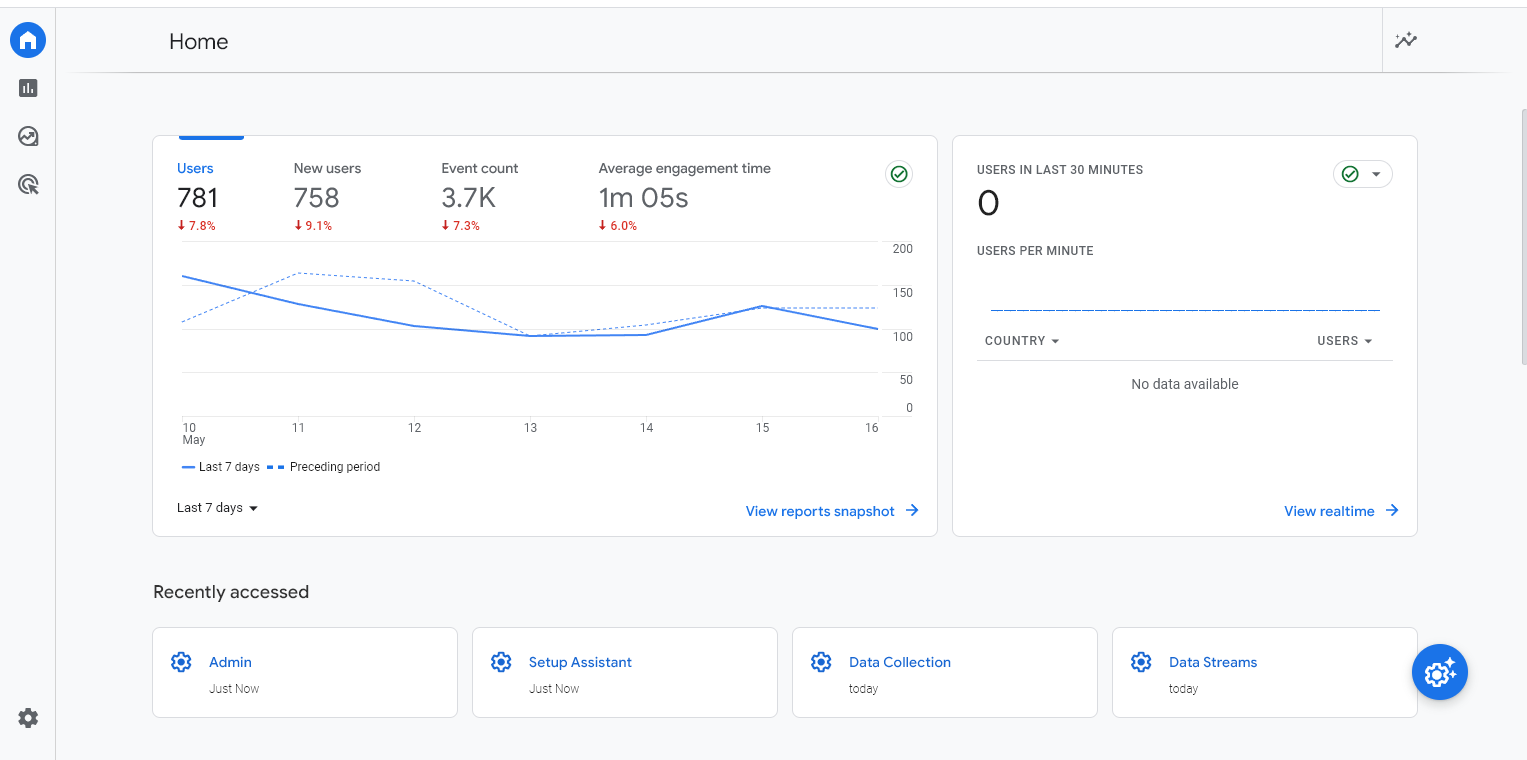
Use the buttons on the left to run reports, create explorations, and more:
As you can see in the graph above, you’ll only be able to view data from where your GA4 account was created (on April 29, in this case). You need to switch back to your UA property to view older data.
Step 4. Do You Need a New GA4 Tracking Code (Site Tag)?
You might remember that when you set up Google Analytics (using the Universal Analytics property) a few years ago, you added a special site tag or tracking code to your website.
With Google’s Setup Assistant, you don’t need to change the site tag. As Google explains, the Setup Assistant “sets the GA4 property to receive data from your existing Google tag if you choose to reuse an existing site tag.” This is what Google recommends.
However, if you want to use a new site tag or don’t have an existing one, you can find instructions here for installing your GA4 site tag.
How to Create a Google Analytics Account for the First Time
What if you’re setting up Google Analytics for the first time? The good news is that it only takes a few minutes to configure Google Analytics—then it will work away collecting data without you needing to do anything.
Your brand new Google Analytics account will automatically use Google Analytics 4.
Here’s how to create your account.
Step 1. Creating Your Google Analytics Account
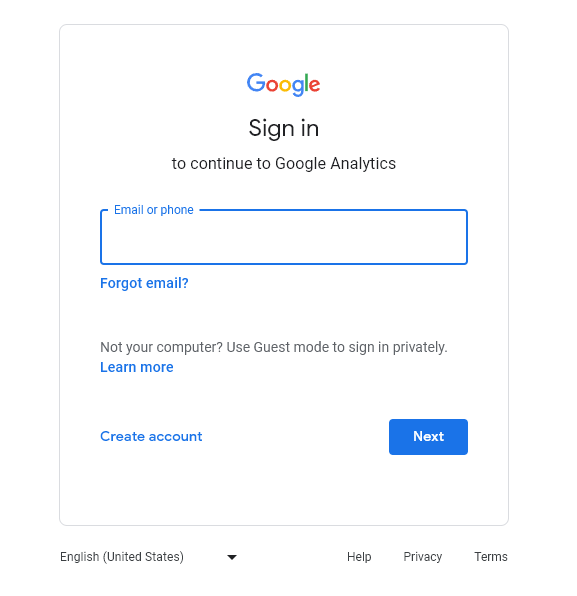
First, go to analytics.google.com/analytics/web. You’ll be prompted to sign into your Google account. (If you don’t have a Google account, you can create one now.)
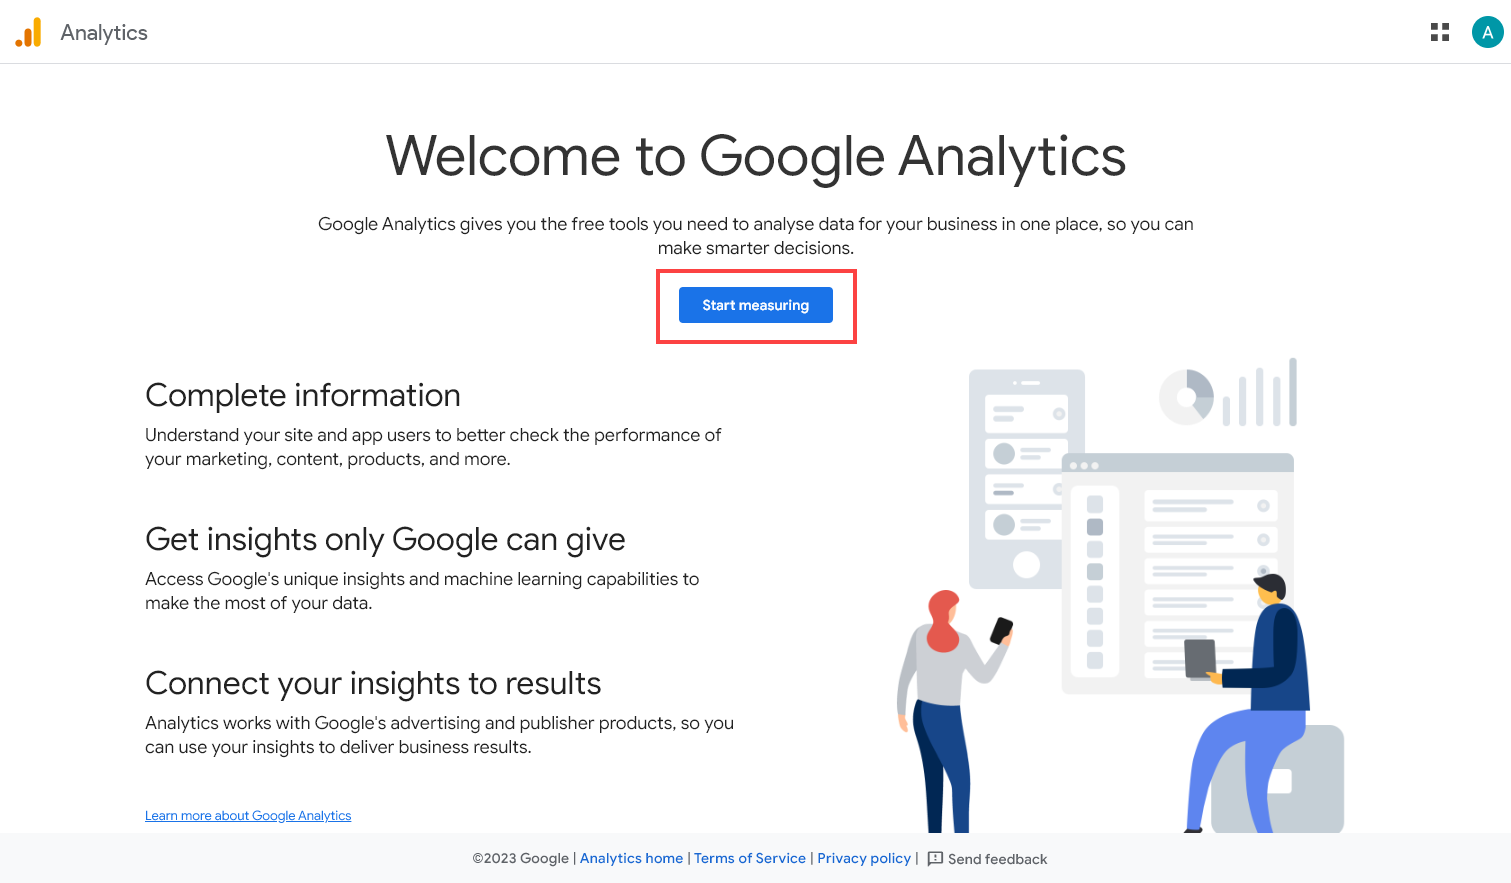
Once you’ve signed in, you’ll see a welcome page. To continue, click the “Start Measuring” button.
Next, you need to fill in your account name and decide whether to allow various data-sharing options. It’s fine to leave these as the defaults.
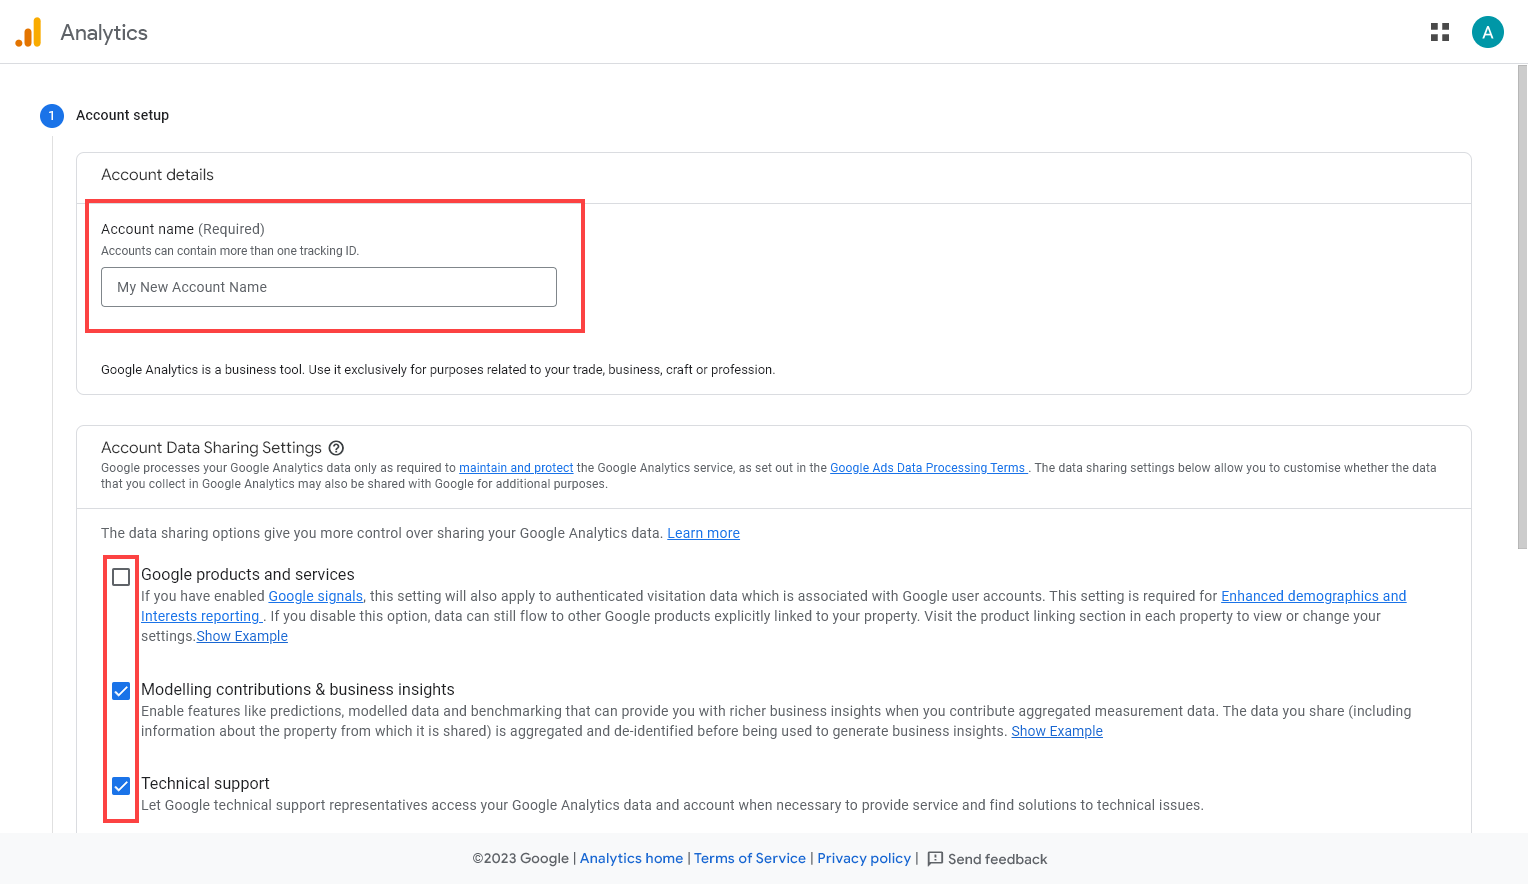
Once you’re ready, click the “Next” button. (You may need to scroll down a little to see it.)
Step 2. Enter Your Property Name and Details
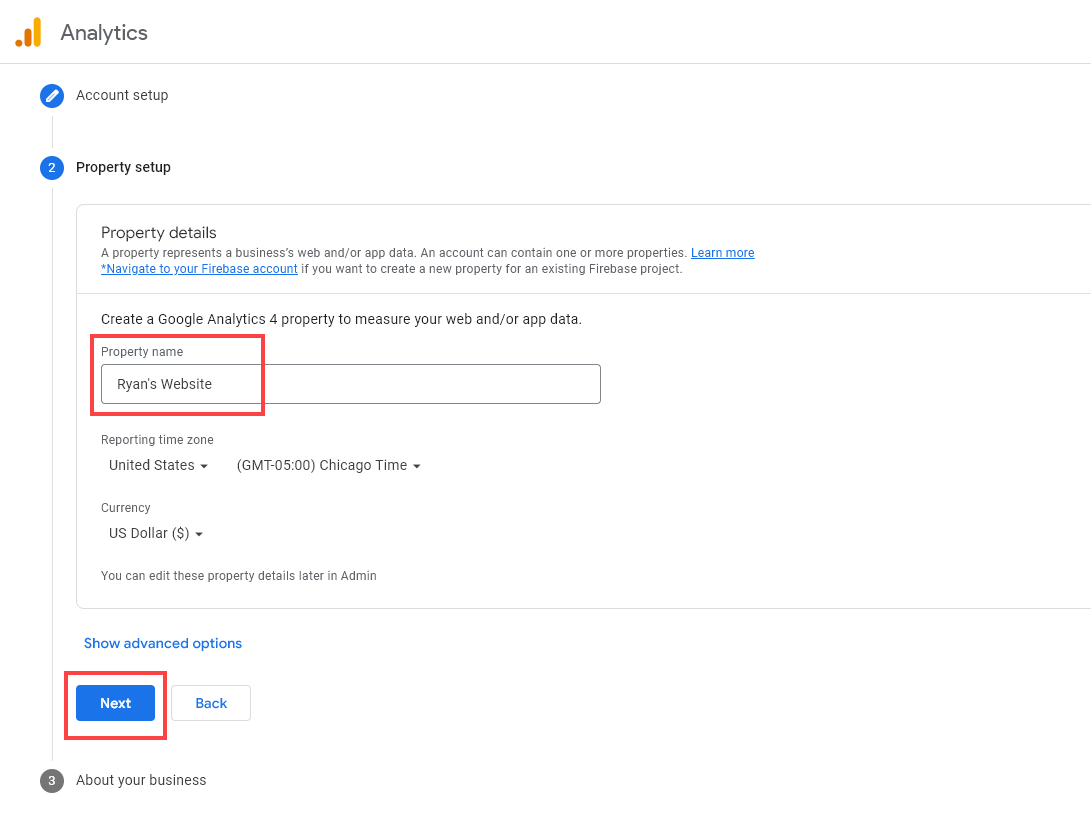
Next, Google Analytics will ask for your “Property name.” You can use your website’s name for this.
The “Reporting time zone” and “Currency” should default to your local time zone and currency. You can change these if you want to. Just click “Next” when you’re done.
Step 3. Tell Google Analytics About Your Business and Create Your Account
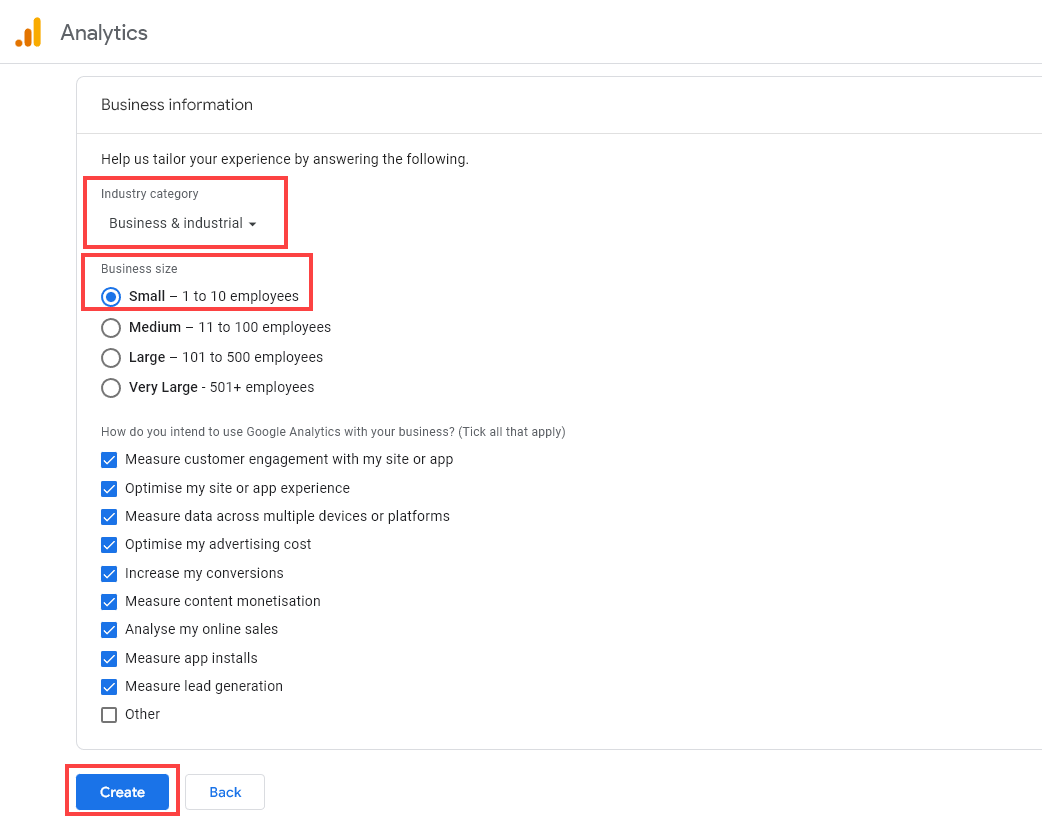
Google Analytics will now prompt you for information about your business. You just need to select your industry, business size, and how you want to use Google Analytics. (If you’re not sure, it’s fine just to check everything here.)
Then, just click “Create.”
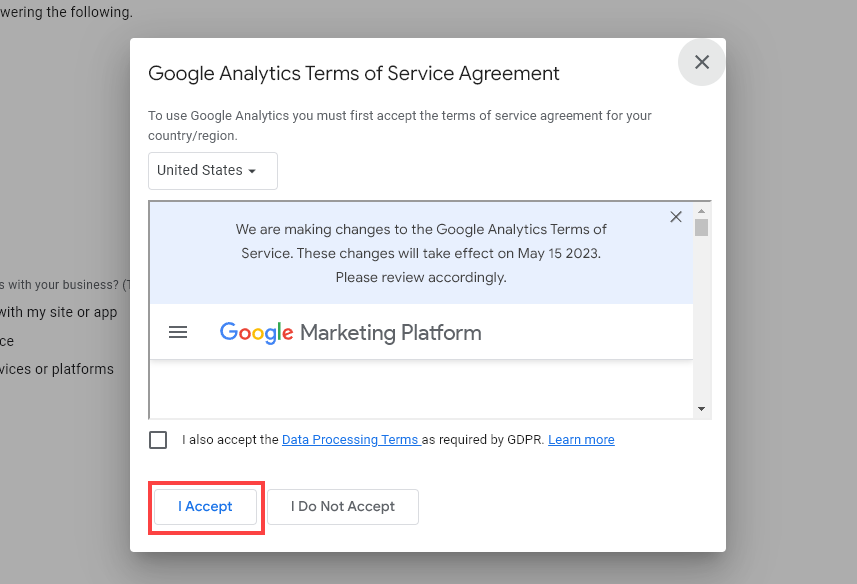
After clicking the Create property button, a popup with Google Analytics’ Terms of Service will appear. Read this, then click “I accept.”
Tip: If you’re unsure whether to accept the data processing terms required by GDPR, you can leave that box unchecked and change this setting later.
Google Analytics will now create your account and your property.
Step 4. Set Up Data Collection for Your Website
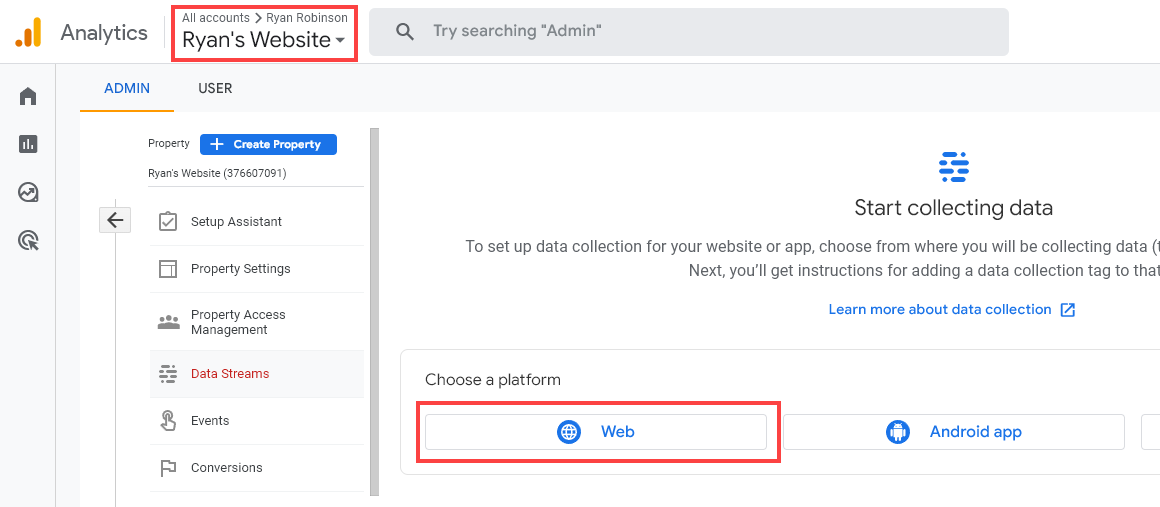
You’ll see a page with your account name and your new property selected (shown on the top left).
You now need to link your Google Analytics property to your website so Google Analytics can collect your data. Under “Choose a platform,” click the “Web” button.
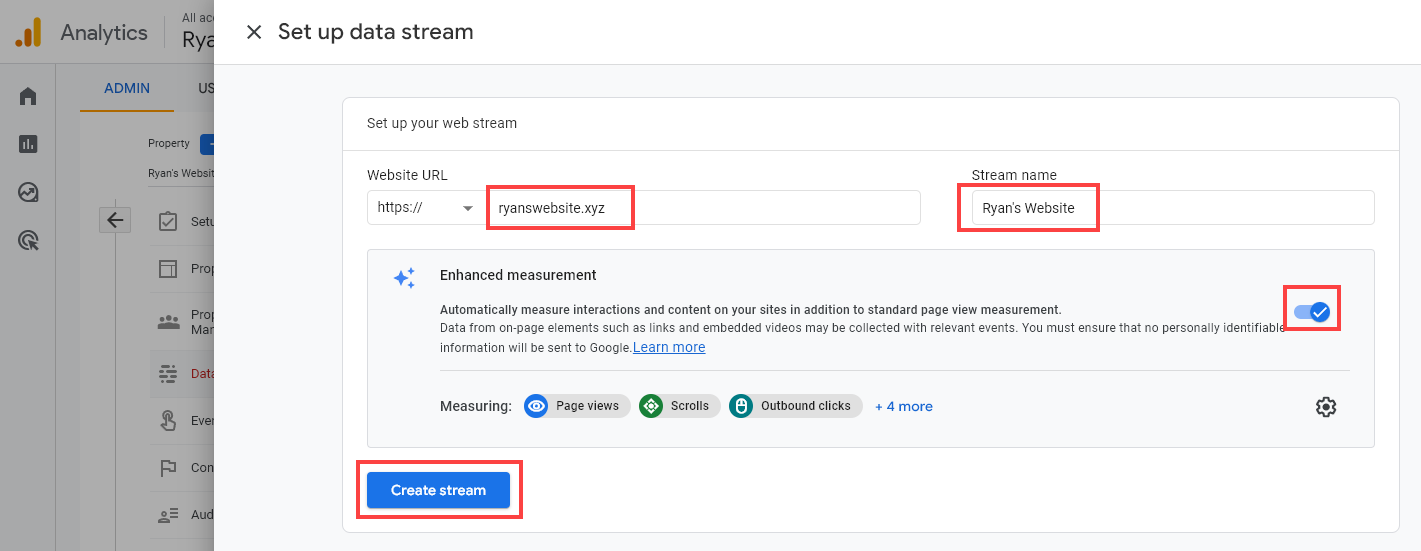
Google will give you a form to set up your data stream. You just need to put in your website’s URL and add the Stream name (it usually makes sense to use your website name here).
I recommend that you leave enhanced measurement turned on.
Then, click “Create stream.”
Google will now create a special “Stream ID” and “Measurement ID” for your website.
The “Measurement ID” is the piece of tracking code (sometimes called a “site tag”) that you need to add to your website:
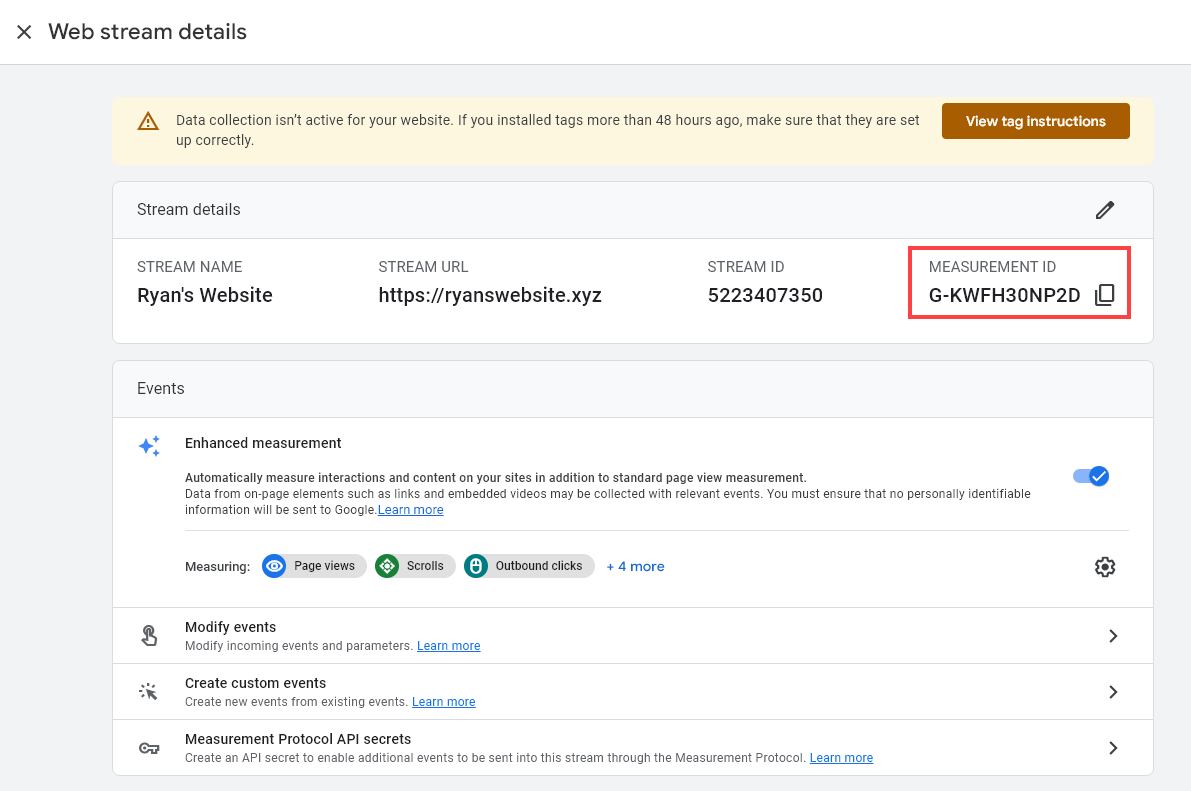
To add it to your WordPress site, scroll to the “View tag instructions” box at the bottom of the page.
Click on this to see a page with instructions for your Google tag. Click the “Install Manually” tab to view the Javascript code for your unique tag:
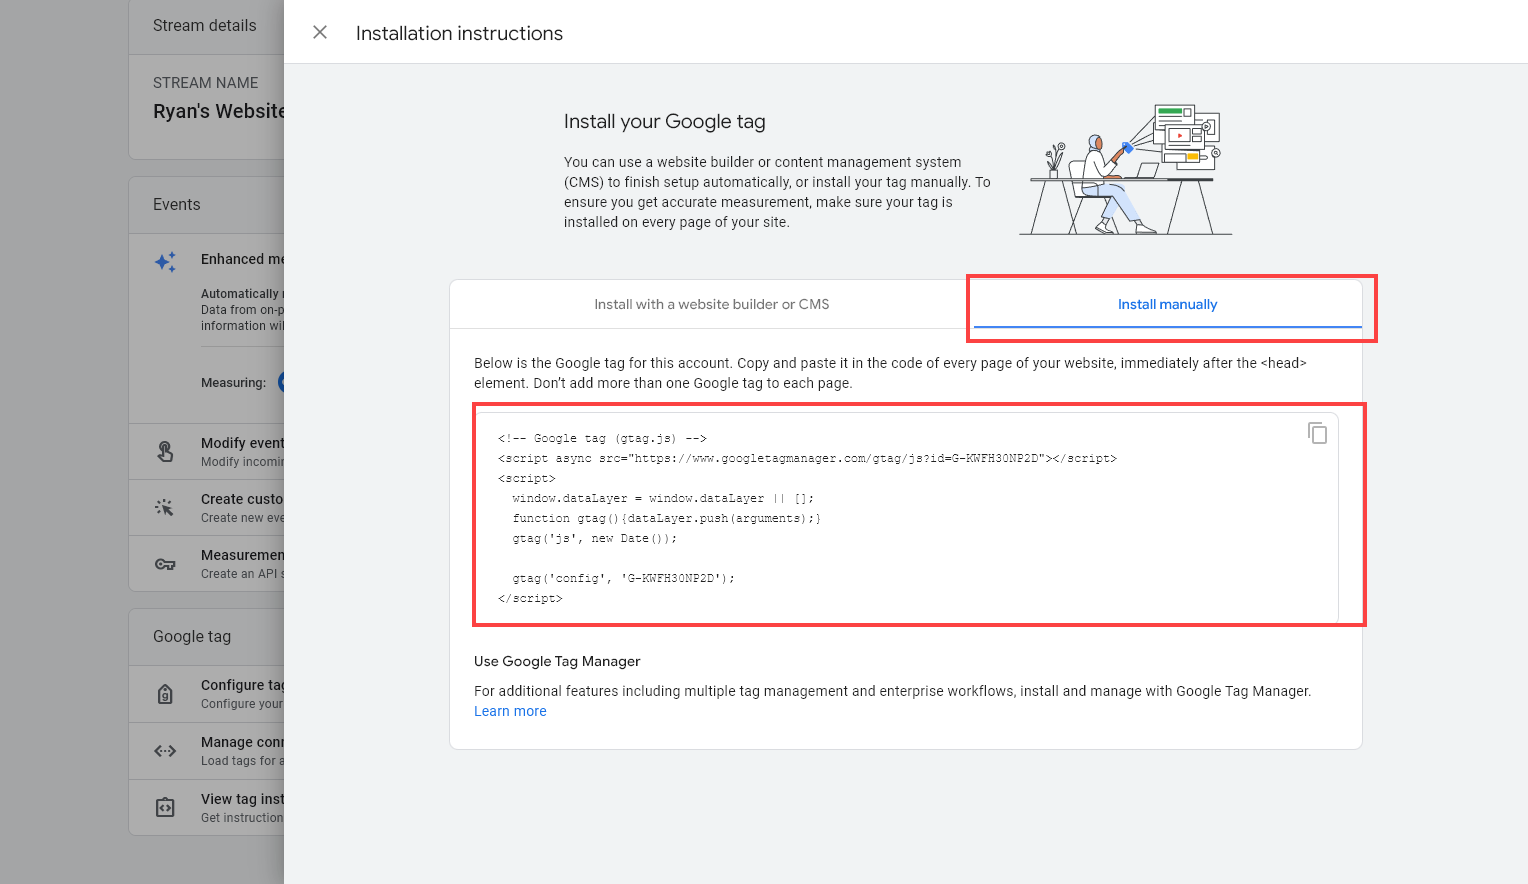
Keep this open while you log in to your WordPress site in a separate tab.
Adding the Google Analytics Tracking Code to Your Website
The simplest way to add the Google Analytics tracking code (Measurement ID) to a WordPress website is to use the WPCode (Insert Headers And Footers) plugin.
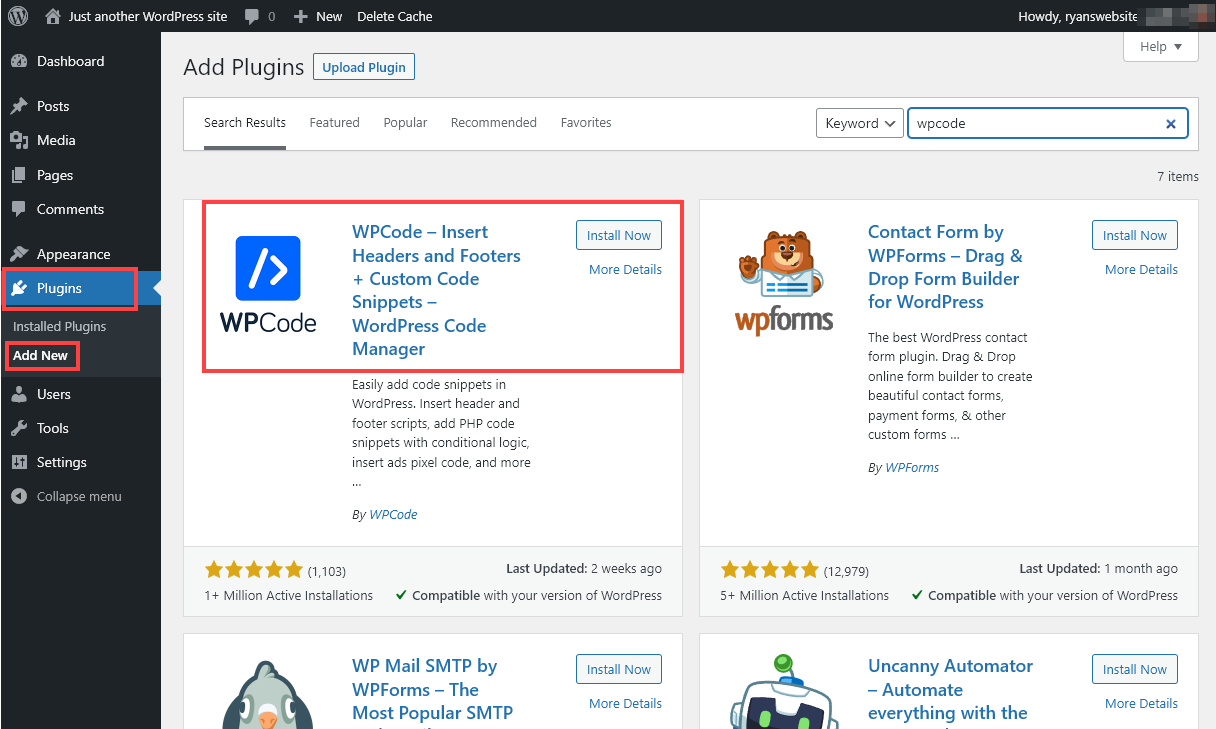
Step 1. Install and Activate the WPCode Plugin
Log in to your WordPress website and go to Plugins→Add New. Search for the “WPCode” plugin and click the “Install Now” button next to it.
Once you’ve installed the plugin, click “Activate”.
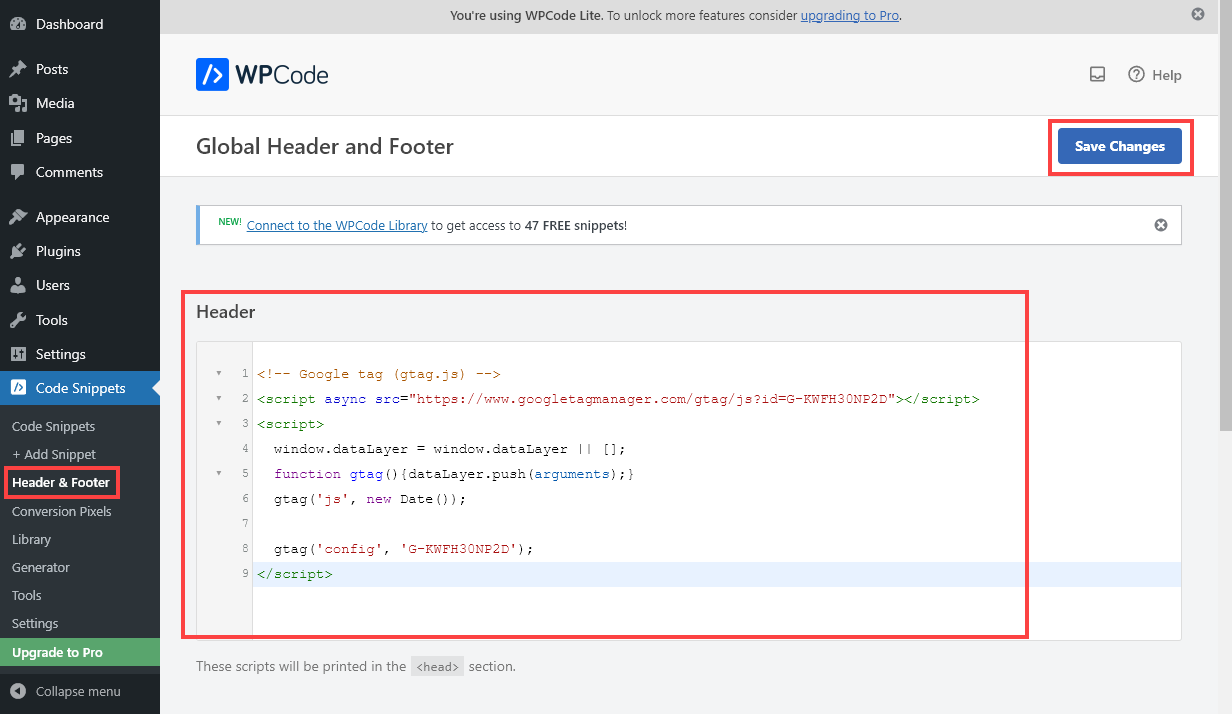
Step 2. Add Your Measurement ID
After activating the WPCode plugin, you’ll see a new “Code Snippets” tab in your left-hand navigation menu. Click Code Snippets→Header & Footer.
Then, simply copy the Javascript code that Google Analytics gave you into the Header box and click Save Changes:
You’ve now connected Google Analytics to your website. However, you may need to wait up to 48 hours before It starts receiving data.
Once it’s working, you can visit your website yourself, and you should see that traffic when you log in to Google Analytics:
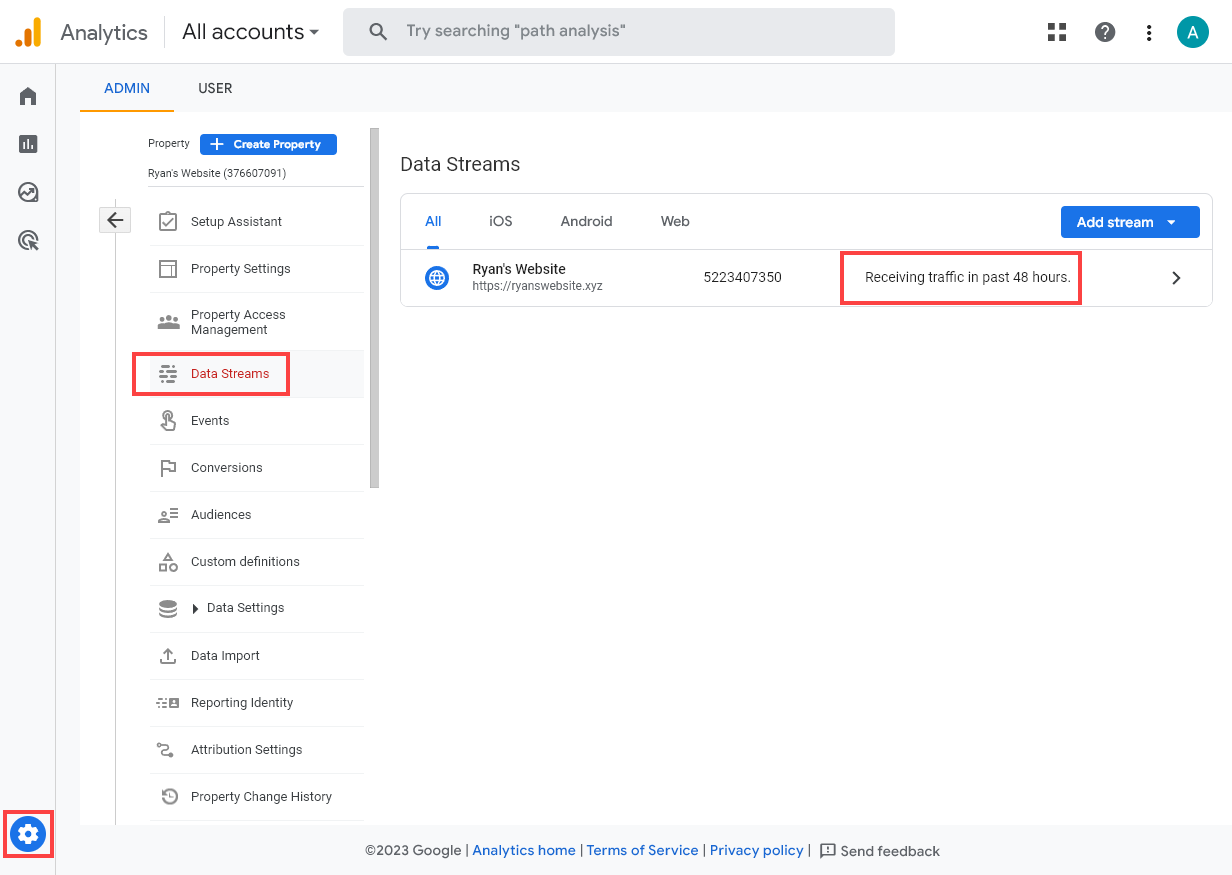
You can also check that Google Analytics is receiving data by going to Admin→Data Streams and looking for your website. It should be listed as “Receiving traffic in past 48 hours:”
Understanding Metrics from Google Analytics 4 (to Help Grow Your Traffic)
Whether you’ve used Google Analytics a lot or are quite new to it, Google Analytics 4 can look a little complex at first glance.
Let’s review some basics to help you understand the data that Google Analytics is showing you.
Understanding the Google Analytics Home Page
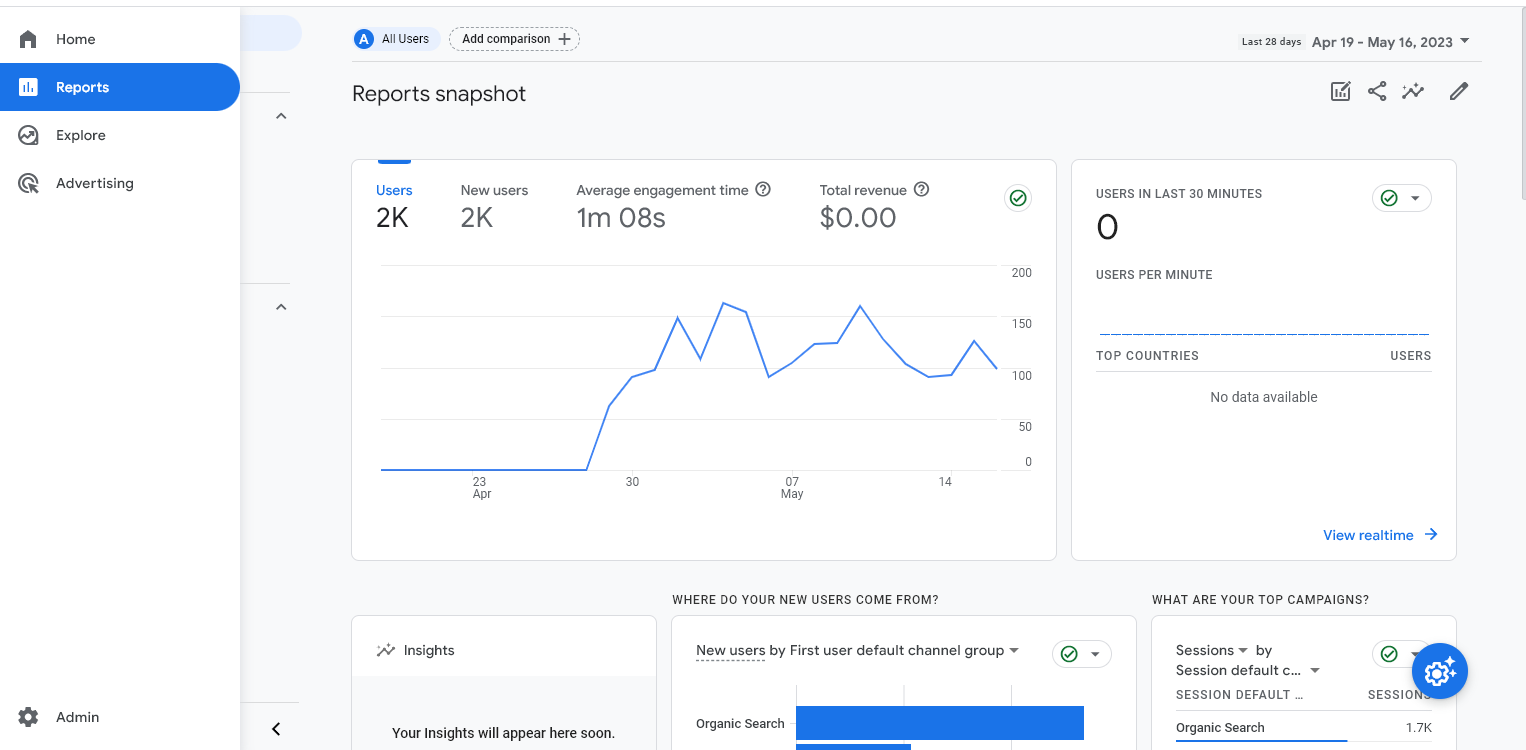
When you view your GA4 property, you’ll see a “Reports snapshot” home page with some basic information. If you’ve never used Google Analytics before, it’s fine to view this page and stop there! There’s enough here to be useful to you.
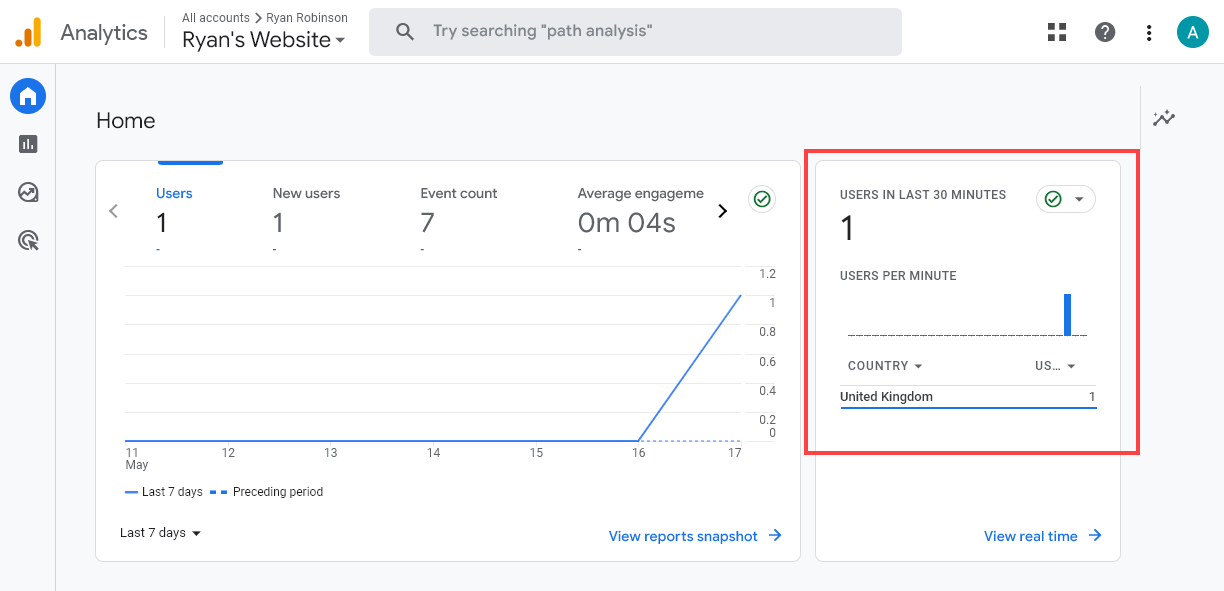
The home page looks like this. I’ve added numbers to some key parts that we’ll run through.
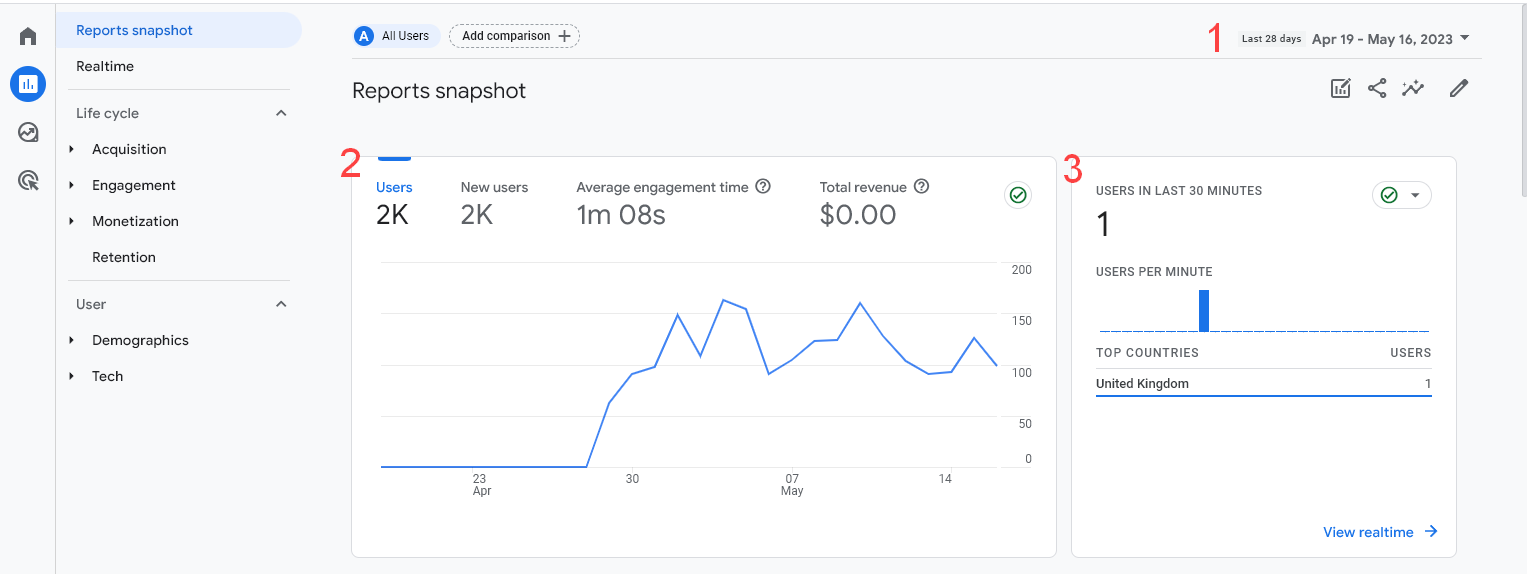
- On the top right, you’ll see a date range. This defaults to the past 28 days. You can change it to anything you want to see, such as a different snapshot.
- The big graph here shows some key data for the date range selected. This gives you some quick insights: a rough estimate of your total users, whether your traffic is peaking or falling on specific days of the week, how long people are staying engaged with your site on average, and how much revenue your site is bringing in (if you’re tracking that in Google Analytics).
- The box on the right shows real-time data, which shows what’s happening on your site right now. Real-time reports can be a useful way to check that Analytics is working and give you up-to-the-minute insights.
You’ll see other details once you scroll down the Reports snapshot page. We’ll take a look at a couple of key sections here:
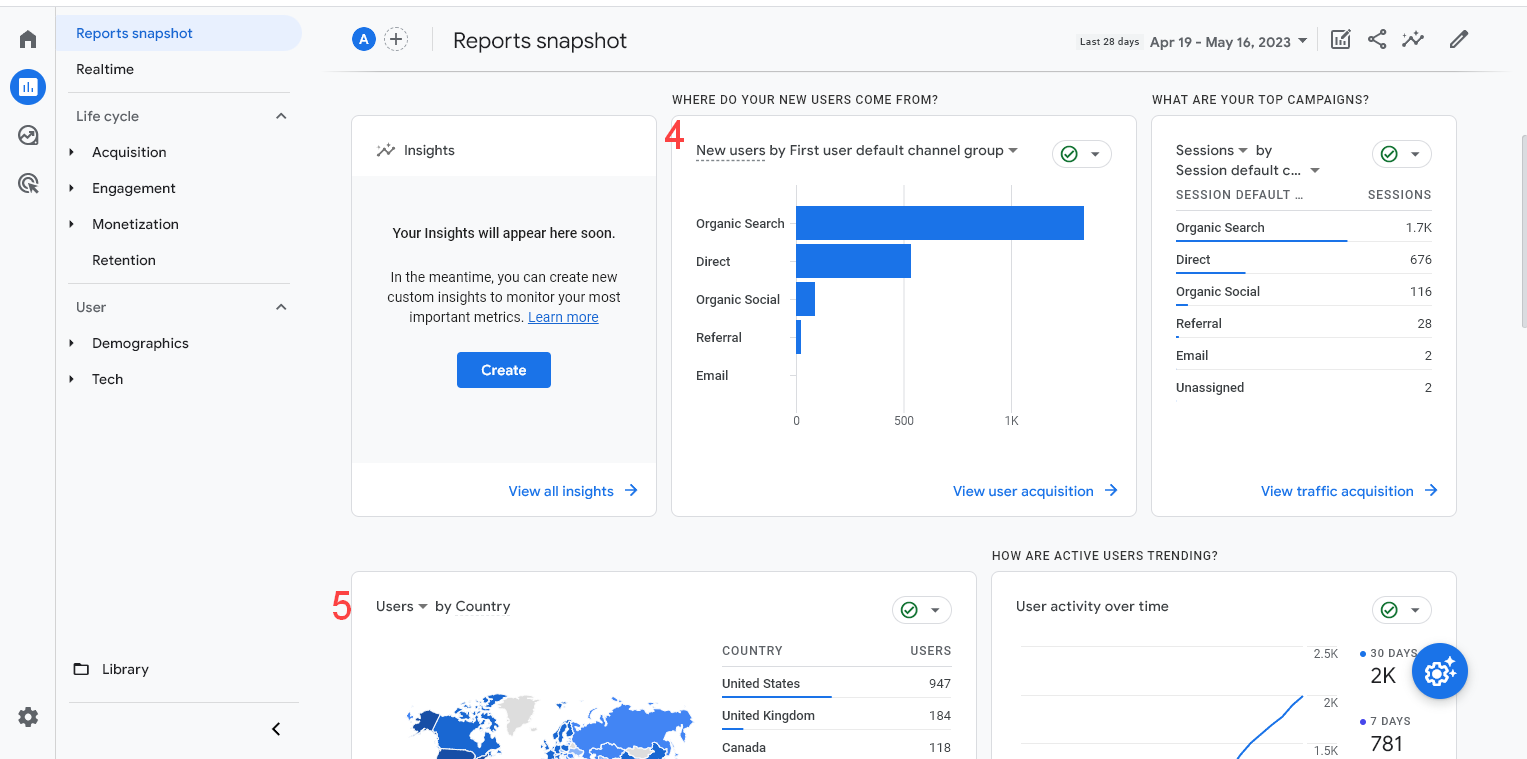
- The snapshot showing where users come from lets you know what’s bringing you the most traffic. For most website owners, organic search will drive the majority of traffic. If you’re not getting much organic search traffic, you might want to improve your blog’s SEO.
- The snapshot of users by country shows where your users are coming from. This can be useful for writing content and selling products. If you have many users from the UK, for instance, you might look for a way to offer cheaper shipping to that country.
Creating Your Own Analysis (Reports and Exploration)
The “Reports snapshot” gives you some handy overviews, but you’ll likely want to dig deeper into your data. We’ll only have time to scratch the surface here of what you can do—but I’ll link to other resources to help you learn more.
Running Google Analytics Reports
Click the “Reports” tab on the right-hand side to delve into your data in various ways. These are split into:
- Acquisition: How users visit your site (e.g., search engine vs social media).
- Engagement: What content users view, what “events” occur (e.g., “first visit,” “page view,” and events you’ve set up yourself), and more.
- Monetization: If you have an eCommerce store, these reports can show you things like the items users added to their cart.
- Retention: This report shows how many users are coming back to your site (rather than just visiting once).
- Demographics: User demographics (country, city, and language, as well as age and gender, if available).
- Tech: The browser, operating system, and device visitors use to access your site.
You can adjust the date range and edit comparisons using the buttons on the top right. Here’s the “editing comparisons” button (shown in red):

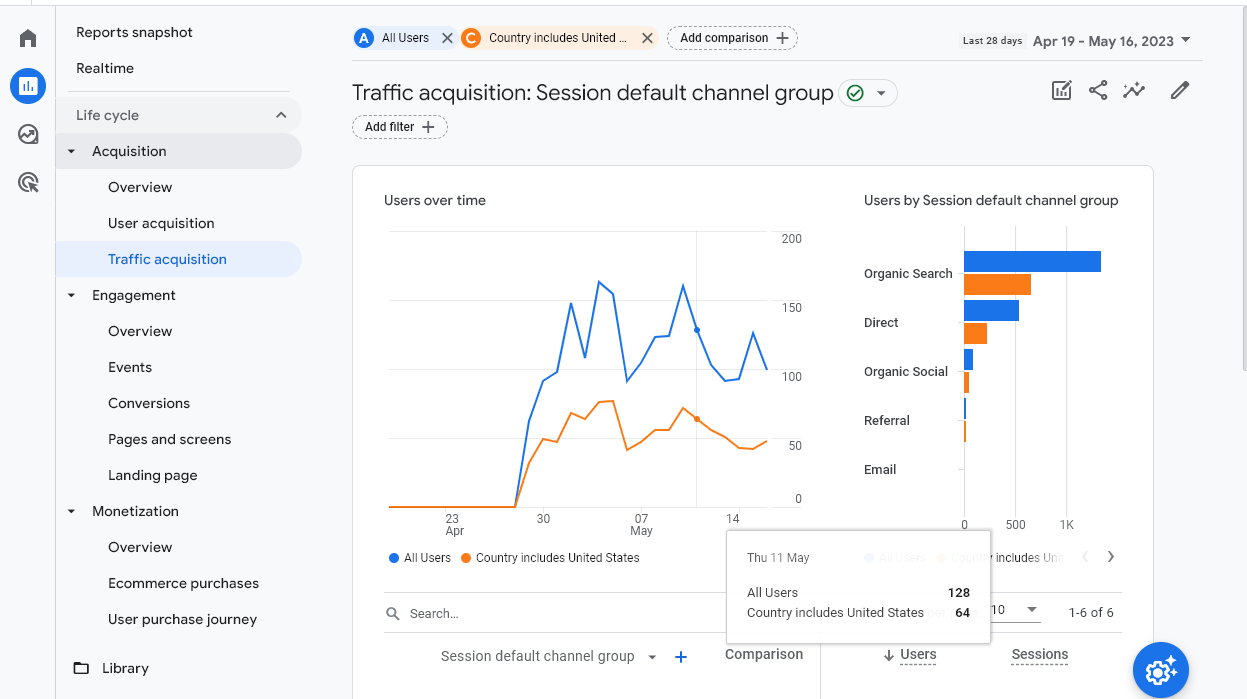
With a comparison, for example, you might want to view statistics for all your users vs statistics for users only in the United States:
You can also compare dates using the date picker’s “Compare” feature.
Creating Google Analytics Explorations
One impressive feature of Google Analytics 4 is the Explorations. These go beyond advanced reports and let you dig deep into your audience’s behavior.
To get started, head to the Explorations tab on the left-hand side:
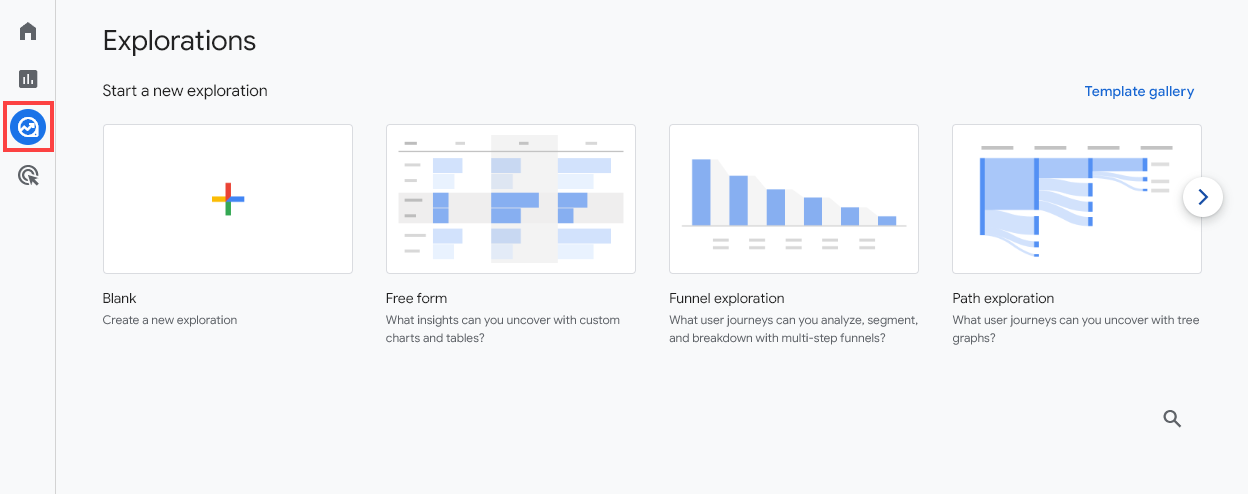
You can choose to create a blank exploration or start with a template. You might want to start with the “Free form” template, allowing you to experiment with custom dimensions, segments, and more. For instance, here’s a free-form template where I’ve selected a breakdown by Country, visualized as a map:
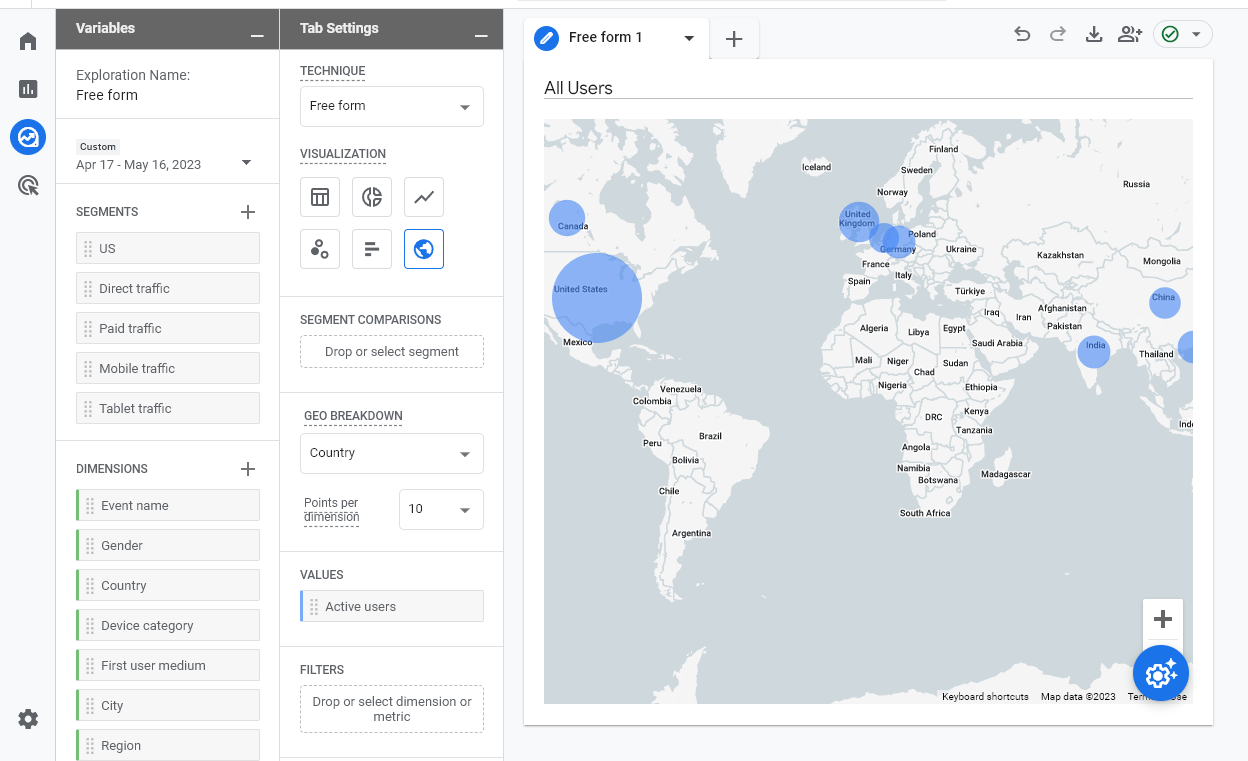
This is a really simple Exploration, but hopefully, it will give you an idea of the types of things you can look at. Google Analytics has a lot of information on how Explorations work here.
A few more things you may want to look into as you go further with GA4 are:
- Setting up custom events for key things you want to track (e.g. visiting a specific page, making a purchase).
- Creating an attribution project will help you better understand your customer’s journey.
- Adding Google Analytics integrations—particularly with Google Ads, but you may also want to look into other integrations that can use the GA4 API.
- Setting up Google Analytics for your mobile app, if you have one. Google Analytics integrates seamlessly with Firebase, Google’s app development platform.
- Using Google Tag Manager (gtag.js tracking code) on your website to refine the data you collect and send to Google Analytics.
- Upgrading to the (premium) Analytics 360 if you have a large business.
Believe it or not, that’s just the tip of the iceberg with GA4. I’m still learning A LOT about this analytics platform, especially the capabilities of Explorations to create very detailed reports and views.
Get Google Analytics 4 Set Up Today
Google Analytics 4 might sound a bit complicated or technical, but it’s straightforward to set up and use.
Make the switch (or finish setting up the property that Google Analytics automatically created for you) as soon as possible. That way, you won’t miss out on any data or new features—and you can use metrics from Google Analytics to help you make good digital marketing decisions.
From July 1, 2023, Universal Analytics properties will stop receiving data. You want to ensure that (a) your Google Analytics 4 property is up and running correctly and (b) you’re at least familiar with the new interface before that time.
What if you don’t have your blog or website online yet? No problem: just follow my instructions to set up your blog before coming back to this tutorial. It’ll only take 5–10 minutes to work through the steps to set up your Google Analytics 4 account.
Create Automated SEO Blog Posts in Minutes with RightBlogger
Join 45,417+ bloggers, marketers, writers & business owners in using RightBlogger, my very own Autoblogging solution with a built-in automated Content Schedule, and a kit of 80+ powerful tools for blogging, SEO, and marketing. You’ll create AI SEO-optimized content faster & get more traffic from Google and ChatGPT today. Plus, you’ll access online courses, a community, and more.